About
Background
Seasonal influenza results in annual epidemics, which infect 5-15% of the U.S. population, causing up to 50,000 deaths, and exceeding an economic burden of $87 billion/year. The patterns of influenza epidemics vary, driven by environmental and climatic factors, as well as heterogeneous contact patterns, age-specific transmission processes, vaccine coverage and efficacy, strain severity and strain dynamics. While there exists heuristic knowledge of these complex processes and patterns, our current ability to systematically and effectively predict important details of seasonal influenza outbreaks remains limited. A reliable spatial and temporal understanding of influenza, based on both data and an understanding of the underlying drivers of outbreaks, could play a critical role in public health decision making and be invaluable towards reducing the burden of morbidity and mortality caused by influenza.
Project Goals
Our aims are two fold: (a) to understand how the spatial scale of disease data can drive our understanding of the dynamics and our ability to predict future outbreaks, and (b) to study the interaction and implications of policy decisions at multiple spatial scales.
Datasets
Healthcare Claims Data Set
The disease-related data used for this project is electronic healthcare reimbursement claims (eHRC) data from a services and technology company that processes healthcare claims from 100,000 healthcare providers across 45 billion healthcare transactions annually in the U.S. For this project, we work with the subset of the data that describes influenza-like illness (ILI), which is defined as a cluster of symptoms commonly used as a proxy for influenza infection. (Influenza is not a reportable disease in the U.S. and thus suspected cases are not required to be lab-confirmed nor reported.) The data of interest comprises over 8.8 million records of weekly ILI activity across 935 zipcode prefixes (i.e. first three digits of U.S. zipcodes) in the United States from the year 2001 to 2010. The Centers for Disease Control and Prevention (CDC) relies on a similar set of data for flu surveillance, but one focused on only 1800 providers, which comprise only outpatient facilities and are aggregated to large age groups. Our eHRC data represents up to 5 million patient-provider interactions, and at the peak of an influenza season, over 150,000 interactions per week. It is large and complex, and provide a unique opportunity to study influenza spatial dynamics, age dynamics, and severity in the context of seasonal influenza policy as well as preparedness for the next influenza pandemic.
Influenza Policy Data Set
The policy data used in this project was collected from the websites of state and county health departments in three states: California, Texas and North Carolina. These three states were chosen as representatives of three regions of the United States where influenza dynamics and public health systems differ. Within each state, data were sampled for ten counties each, using a stratified sample by county population size. We focus on policy-related data about influenza vaccination campaigns found at each health department website, including access to information about flu vaccination, access to free flu vaccination, and vaccination recommendations to target groups. Further information can be found on the Policy page.
Modeling
Influenza dynamics lend themselves to a complex structure characterized by multiple scales in space. The choice of an appropriate scale for the study of spatial processes is an extremely important one because (a) mechanisms vital to the spatial dynamics of a process at one scale may be unimportant or inoperative at another; (b) relationships between variables at one scale may be obscured or distorted when viewed from another scale; and c) control strategies can be implemented at different spatial scales, with different levels of information and resources at each.
Spatial Scales of Influenza Severity
The causes and characterization of the severity of influenza seasons and pandemics are crucial aspects to understanding influenza epidemiology and designing effective surveillance and control programs. We examined spatial patterns of influenza severity by calculating a state-specific severity index. Regardless of national-level severity, state-level severity could range from mild to severe in a single season (see Lee, E.C., Viboud, C., Simonsen, L., Khan, F., Bansal, S. (2015) Detecting signals of seasonal influenza severity through age dynamics. BMC Infectious Diseases 15: 587). The figure below shows these patterns for each season.
Season:
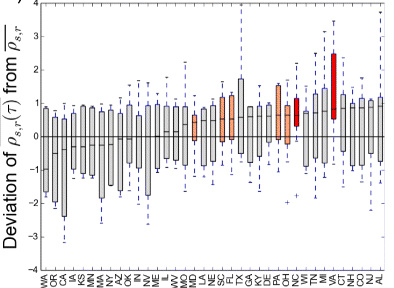
To understand the impact of studying severity at the scale of states rather than at a national scale, we measure deviations in state-level severity from national-level severity. The figure below shows results from this analysis, and also allows us to identify states that may have experienced more mild or more severe influenza seasons than the national average. Across the eight study seasons, the adjacent Mid-Atlantic states of Virginia and North Carolina may have experienced more severe seasons than the national average severity, and other adjacent Mid-Atlantic and Midwestern states like Ohio, Pennsylvania, Florida, South Carolina, and Maryland may have experienced somewhat more severe seasons than the national average.
Details on the methods of this study and additional results can be found here.
Explore
There is a growing need for fusing, analyzing and comparing dynamic data sets. In order to support novel analytic processes that provide utility to those monitoring influenza, our site presents a visual analytic tool that lets investigators interactively explore the dynamics of influenza at different spatial and temporal scales. We believe that interactive visualizations can change the way that policymakers and researchers understand influenza's epidemiology by enabling in depth exploration of spatiotemporal data and by presenting slices of data that are intuitive to hypothesis making.
Here we look at the reported rates of influenza-like illness (ILI) in different states during different times. In this dataset, a 'season' is from October to September of the following year. This exploration section consists of a dashboard of three visualizations that highlight reports of influenza across different dimensions. The map of the United States shows incidents of ILI in every state for across all ten years or annually. To see a more detailed spatial view of the data, one can click on a state and see the incidents of ILI at the zip-3 level. The radial chart on the right shows the data for all 10 years by month, allowing for a comparison of flu-like incidents across years of seasonal incidents at the national or state level. These three visualizations highlight the multi-resolution capability of this tool. They highlight when the flu season begins early or goes late when compared to other years. Finally, the histogram on the bottom allows for easy state level comparison of incidents, as well as annual comparison of a particular state.
Map
Explore spatial variation of ILI
Click to zoom in on a particular state
Hover for details
Click again to change states or zoom out
Bar Chart
Explore variation of ILI across seasons
Click to view data for a season or state
Hover for details
Click background to reset data
Sort using the drop-down menu
Radial Chart
Explore temporal variation of ILI seasons
Click state or season (on map or bar chart) to update
Hover for details
Season:
Sort by:
Compare
Description
Order:
Spatial Variation in Influenza Vaccination
In addition to influenza spatial dynamics and their mechanisms acting on multiple spatial scales, public health policy decisions to prevent and mitigate influenza are also made at many scales, based on differing levels of information and resources. Here, we explore the spatial heterogeneity in influenza vaccination policy recommendations and in the access to information about vaccination or the vaccine itself. Note that the influenza-like illness reports are tabulated on by 3-digit zipcode basis, while policies are on a county basis.
The policies are summarized as follows:
Access to information: We measure the number of web links that need to be followed to reach information about influenza vaccination from the home page of the state or county health department website.
Access to vaccination: We measure the availability of a free influenza vaccine.
Vaccination recommendation: We identify the target groups that are recommended to get the influenza vaccine on the state/county health department website. Universal vaccination is for all above the age of 6 months. High-risk groups include children aged 6-59 months, elderly over the age of 65, pregnant women and individuals with chronic health conditions. The CDC recommendation includes both the Universal recommendation and all High-risk groups.
Policy
Influenza
Principle Investigators

Dr. Shweta Bansal
Assistant Professor of Biology
Georgetown University

Dr. Lisa Singh
Associate Professor of Computer Science
Georgetown University

Dr. Larry Gostin
Professor of Global Health Law
Georgetown University Law Center
Team Members

Elizabeth Lee
Infectious disease modeler
PhD Candidate, Global Infectious Diseases
Georgetown University

Indy Liu
Vaccination policy analysis
ScD Candidate, Global Health Law
Georgetown University Law Center

Julia Hockett
Visual analytics
Undergraduate, Computer Science
Georgetown University